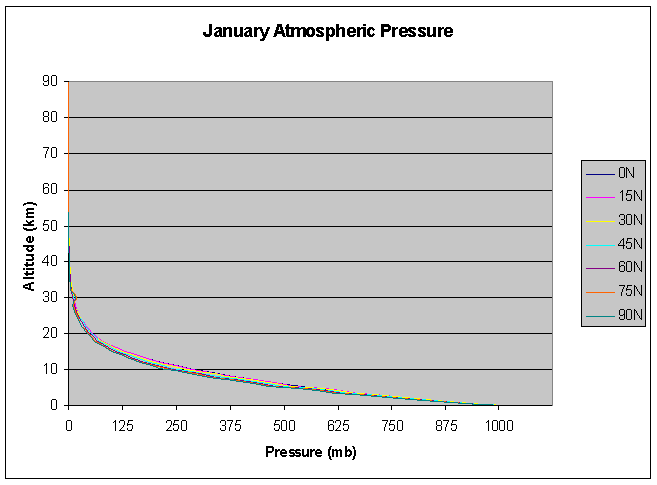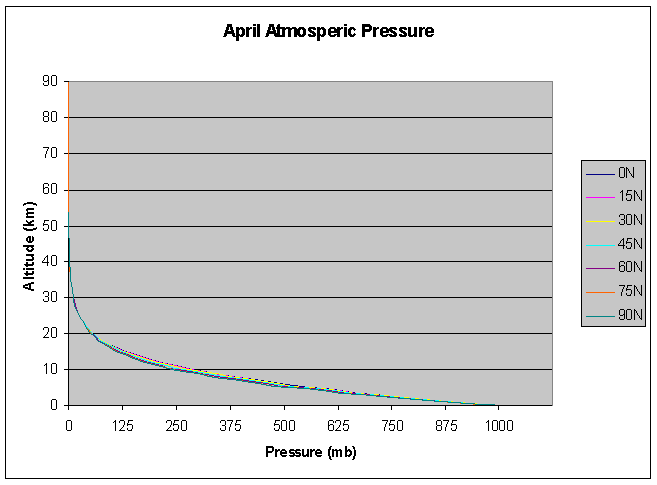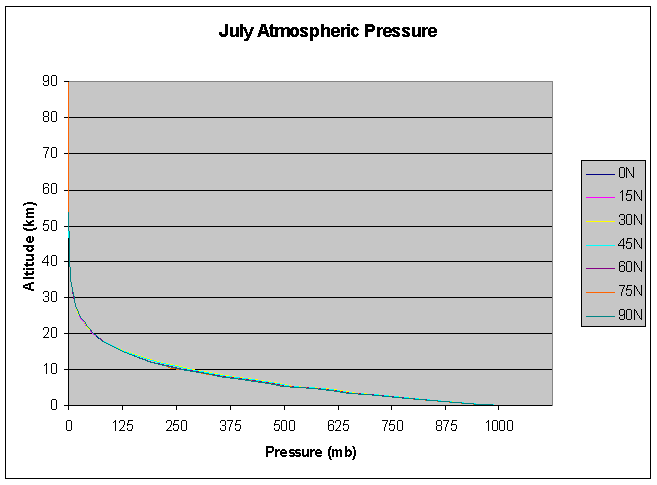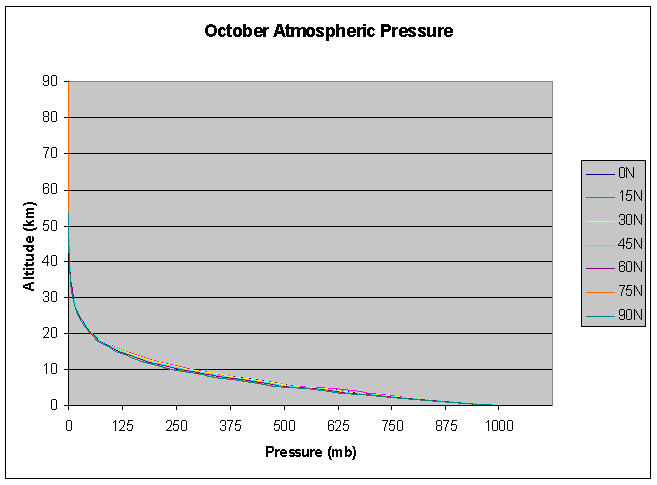

The above graph shows that an increase in altitude results in a drop of pressure. The tropopause starts at about 11km. The stratosphere runs to from 11km to 49km where the stratopause is located. The mesosphere starts at about 49km and runs to 86km. As the graph above illustrates there is no pressure correlation in the given levels, pressure drops off the same at all latitudes even with changing levels.

The April graph basically shows the same information that was displayed above.

July pressures correlate well with the yearly pressures.

<= Examine Seasonal Temperature at Different Latitudes