|
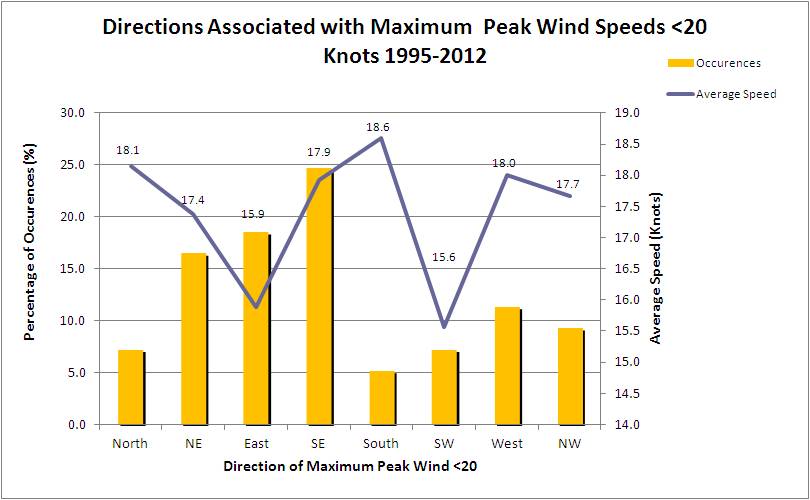
Maximum peak convective wind observations that were < 20 kt for the warm season convective periods most frequently had easterly component directions. | |
| Figure 17a. Directional distribution of maximum peak winds < 20 kt for the 97 convective periods that fell into this category over the 1995-2012 warm seasons. |
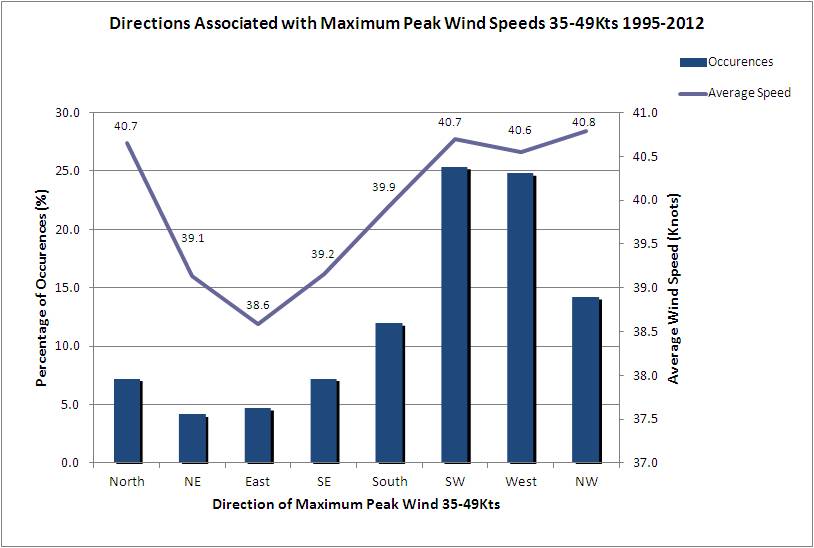 |
Maximum convective wind observations that were in the range of 35-49 kt for the warm season convective periods most frequently came from the southwest and west. Southwest through north winds were the directions associated with the highest peak wind speeds. | |
| Figure 17c. Directional distribution of maximum peak winds of 35-49 kt for the 358 convective periods that fell into this category over the 1995-2012 warm seasons. |