|
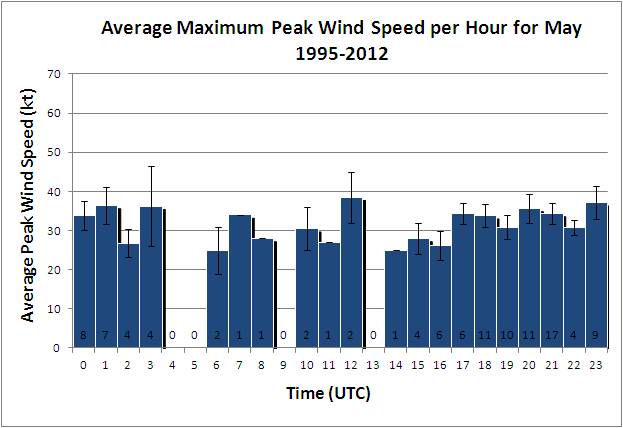
This figure shows that although afternoons in May are more likely to have warning level events, some various other hours of the day have fewer, but can have just as strong or even stronger peak wind averages. | |
| Figure 11a. A 24-hour percentage distribution of the maximum peak observations for each of the 111 convective periods which occurred during the month of May over the 18-year study period. |
 |
The afternoon hours are dominant with average maximum wind speeds peaking at 21 UTC, but there are a few nearly as strong 10-11 UTC events. | |
| Figure 11b. A 24-hour percentage distribution of the maximum peak observations for each of the 256 convective periods which occurred during the month of June over the 18-year study period. |
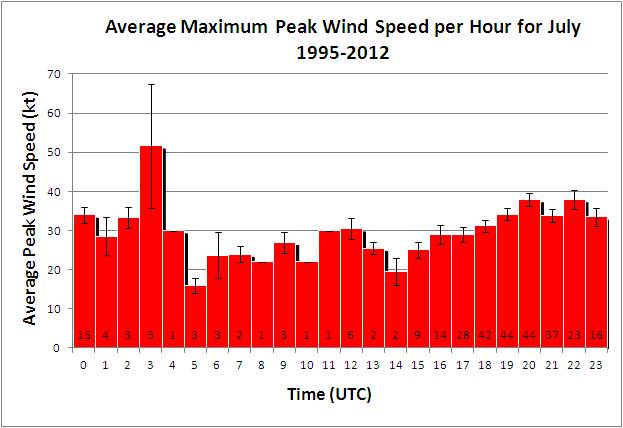 |
The afternoon peak shifts slightly to 20 UTC and 22 UTC in July with the largest peak at 03 UTC, which was due to the fact that two of the three events had significantly strong convective peak winds of 60 and 74 kt. | |
| Figure 11c. A 24-hour percentage distribution of the maximum peak observations for each of the 307 convective periods which occurred during the month of July over the 18-year study period. |
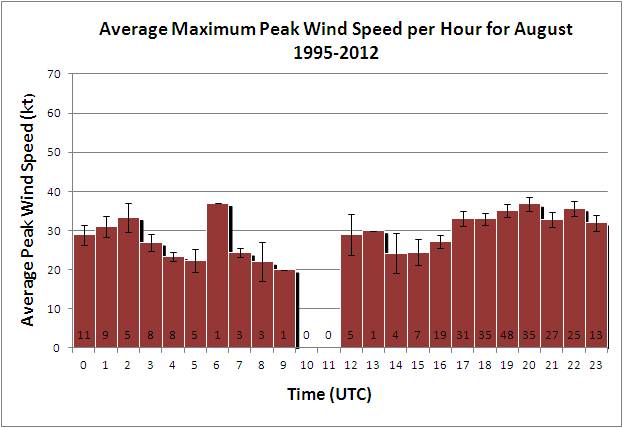 |
The afternoons continue to dominate in frequency and average intensity, but there still can be a few strong events (e.g. 06 UTC) at other times of the day. | |
| Figure 11d. A 24-hour percentage distribution of the maximum peak observations for each of the 304 convective periods which occurred during the month of August over the 18-year study period. |
 |
The afternoon frequency falls and becomes less dominant. The evening and night-time events tend to increase in intensity and the average peak maximum wind associated with these events is about the same or slightly stronger than the afternoon events, | |
| Figure 11e. A 24-hour percentage distribution of the maximum peak observations for each of the 171 convective periods which occurred during the month of September over the 18-year study period. |