 |
This figure shows a flatter overall diurnal distribution and a 20 UTC maximum than the seasonal mean. | |
| Figure 10a. A 24-hour percentage distribution of all convective wind observations for all the convective periods which occurred during the month of May over the 18-year study period. |
 |
The afternoon peak becomes stronger as the thermal forcing increases. | |
| Figure 10b. A 24-hour percentage distribution of all convective wind observations for all the convective periods which occurred during the month of June over the 18-year study period. |
 |
The afternoon peak reaches its maximum during July with some of the strongest daytime heating of the year. | |
| Figure 10c. A 24-hour percentage distribution of all convective wind observations for all the convective periods which occurred during the month of July over the 18-year study period. |
 |
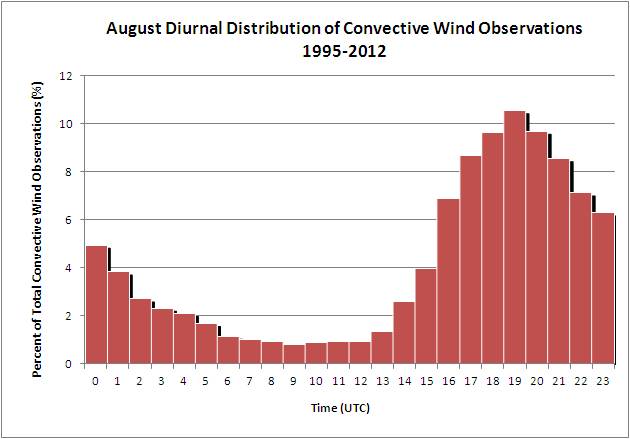
The afternoon maximum drops off a bit from July. | |
| Figure 10d. A 24-hour percentage distribution of all convective wind observations for all the convective periods which occurred during the month of August over the 18-year study period. |
 |
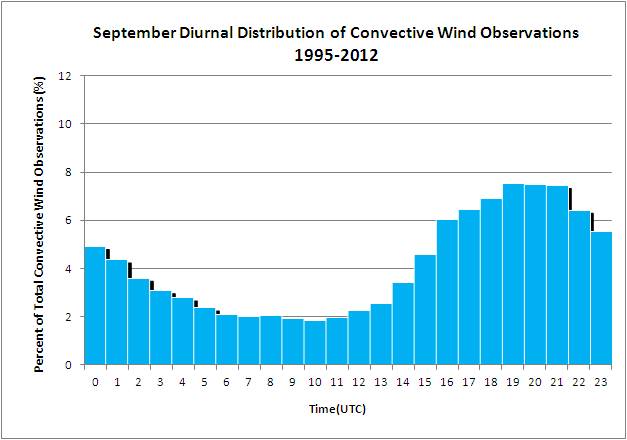
The distribution flattens considerably with a much greater frequency of nighttime/early morning events and slightly later peak at 20 UTC like May. | |
| Figure 10e. A 24-hour percentage distribution of all convective wind observations for all the convective periods which occurred during the month of September over the 18-year study period. |