|
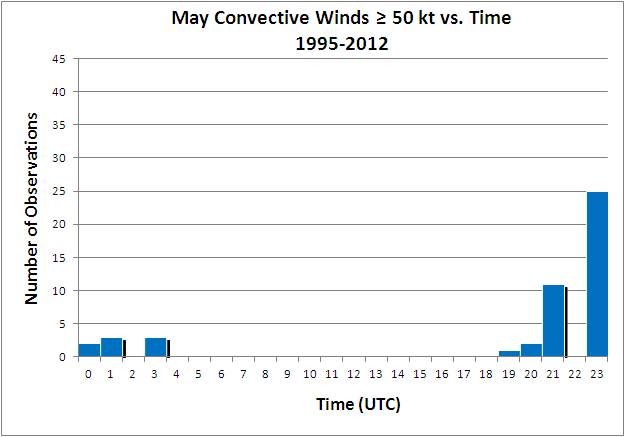
This figure shows that there are not usually many strong wind reports in May with all occurring between 19 UTC and 04 UTC and most of those between 23 UTC and 00 UTC. | |
| Figure 13a. The diurnal distribution of 47 wind observations ≥ 50 kt which occurred during 9 (out of 111 - 8.1%) convective periods in the month of May over the 18-year study period. |
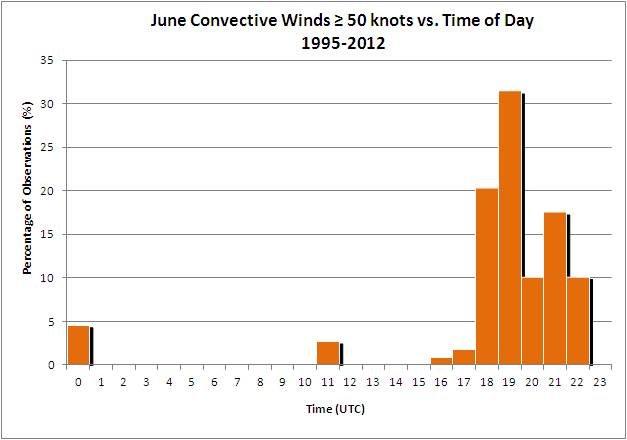 |
Most strong convective wind events have occurred during the afternoon. June has the largest number of strong wind periods (26) ≥ 50 kt than any other warm-season month. | |
| Figure 13b. The diurnal distribution of 108 wind observations ≥ 50 kt which occurred during 26 (out of 257 - 10.1%) convective periods in the month of June over the 18-year study period. |
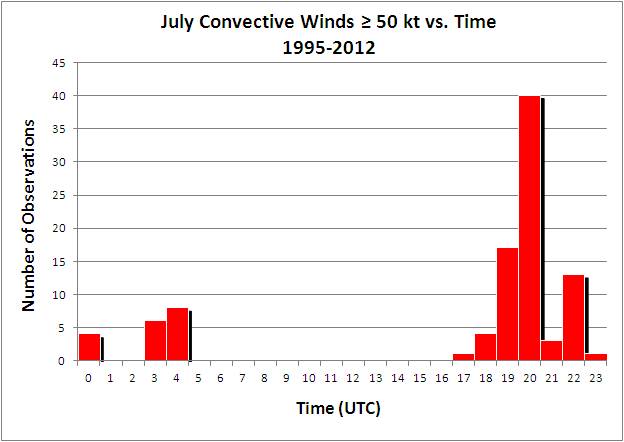 |
The afternoon is the most favorable with a peak at 20 UTC and just a few cases after 00 UTC. | |
| Figure 13c. The diurnal distribution of 97 wind observations ≥ 50 kt which occurred during 23 (out of 306 - 7.5%) convective periods in the month of July over the 18-year study period. |
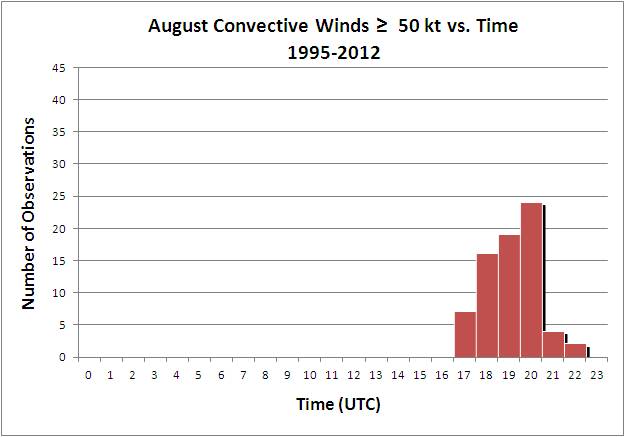 |
The afternoon characteristics continue, but shifts about an hour earlier than July. There were no occurrences of strong events at any other times of the day. | |
| Figure 13d. The diurnal distribution of 47 wind observations ≥ 50 kt which occurred during 21 (out of 307 - 6.8%) convective periods in the month of August over the 18-year study period. |
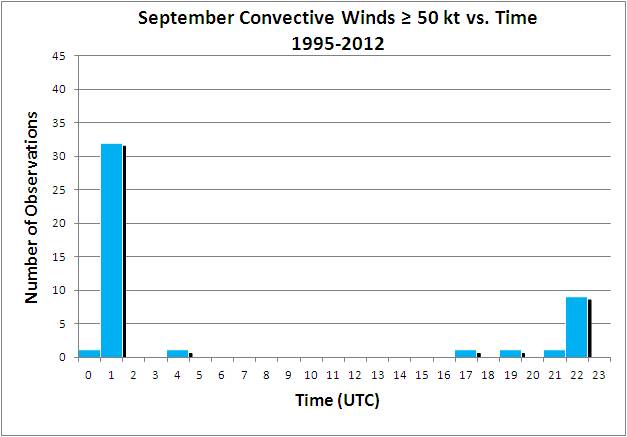 |
The strong events are very rare with two occuring during the afternoon and the other three in the evening. The large number 01 UTC Observations were due to a very strong event on 25 Sep 2001, which had 33 observations ≥ 50 kt. This event had the largest number of strong wind observations for any convective period of any month of the study. | |
| Figure 13e. The diurnal distribution of 46 wind observations ≥ 50 kt which occurred during 6 (out of 168 - 3.6%) convective periods in the month of September over the 18-year study period. |