Frequency/Probability Distributions of Maximum Convective Wind by Month

   The May distribution of the maximum wind speed, associated with each convective period in 5 kt increments, resulted in slightly higher frequencies in the 30-34 kt and 35-39 kt ranges and only slightly lower at the 20-24 kt and 25-29 kt ranges. The Gumbel curve shows a probability peak in the upper 20's, which is not too far off from the minimal 35 kt warning criteria.

The probability of meeting or exceeding any speed threshold, given that convective winds occur, can be found by integrating the Gumbel curve from that speed threshold to infinity. This can be done can be done mathematically by using the equation shown in Figure 15a and plugging in a threshold value for x (in kt). Setting x equal to the threshold values of 35, 50, and 60 kt, yields the probability values shown in Figure 15a.
Figure 15a. Distribution of maximum convective peak wind observations by 5-knot increments, with a Gumbel curve fit to the observed data for the 111 convective periods for the May months in the 18-year (1995-2012) study.


      The June distribution of the maximum wind speed, associated with each convective period in 5 kt increments, also resulted in a peak in the 25-29 kt range. However, the drop off at higher wind speeds is not nearly as pronounced as it was in May. The Gumbel curve maximum is in the upper 20's, similar to May, but probabilities are higher for warning-level winds. In fact, June has the highest probabilities of any of the warm season months for warning level events.

The probability of meeting or exceeding any speed threshold, given that convective winds occur, can be found by integrating the Gumbel curve from that speed threshold to infinity. This can be done can be done mathematically by using the equation shown in Figure 15b and plugging in a threshold value for x (in kt). Setting x equal to the threshold values of 35, 50, and 60 kt, yields the probability values shown in Figure 15b.
Figure 15b. Distribution of maximum convective peak wind observations by 5-knot increments, with a Gumbel curve fit to the observed data for the 257 convective periods for the June months in the 18-year (1995-2012) study.


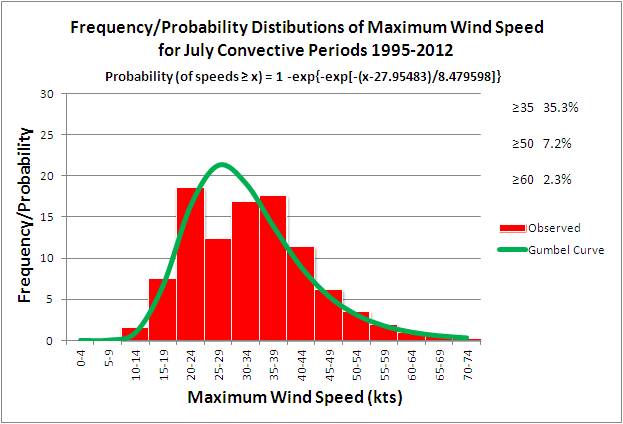
      The July distribution of the maximum wind speed resulted in a peak in the 20-24 kt range and a secondary peak (but only slightly smaller) in the 35-39 kt range, and a tertiary peak (again only slightly smaller) in the 30-34 kt range. The Gumbel curve shows the same peak in the upper 20's as was seen for May and June. Because of the increase in the number of weaker wind events and thus the probabilities for warning-level events are slightly lower than July.

The probability of meeting or exceeding any speed threshold, given that convective winds occur, can be found by integrating the Gumbel curve from that speed threshold to infinity. This can be done can be done mathematically by using the equation shown in Figure 15c and plugging in a threshold value for x (in kt). Setting x equal to the threshold values of 35, 50, and 60 kt, yields the probability values shown in Figure 15c.
Figure 15c. Distribution of maximum convective peak wind observations by 5-knot increments, with a Gumbel curve fit to the observed data for the 306 convective periods for the July months in the 18-year (1995-2012) study.


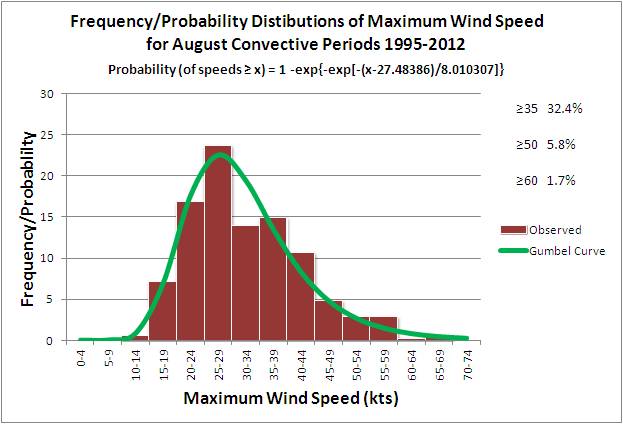
      The August distribution of the maximum wind speed resulted in a peak in the 25-29 kt range and a secondary peak in the 20-24 kt range. The Gumbel curve has a slightly lower peak than May-July, but still in the upper 20's.

The probability of meeting or exceeding any speed threshold, given that convective winds occur, can be found by integrating the Gumbel curve from that speed threshold to infinity. This can be done can be done mathematically by using the equation shown in Figure 15d and plugging in a threshold value for x (in kt). Setting x equal to the threshold values of 35, 50, and 60 kt, yields the probability values shown in Figure 15d.
Figure 15d. Distribution of maximum convective peak wind observations by 5-knot increments, with a Gumbel curve fit to the observed data for the 307 convective periods for the August months in the 18-year (1995-2012) study.


   The September distribution of the maximum wind speed resulted in a peak in the 25-29 kt range and secondary peaks (but only slightly smaller) in the 25-29 kt and 30-34 kt ranges. The Gumbel curve again shifts slightly more to the left, yielding the lowest probabilities for warning-level winds of the season.

The probability of meeting or exceeding any speed threshold, given that convective winds occur, can be found by integrating the Gumbel curve from that speed threshold to infinity. This can be done can be done mathematically by using the equation shown in Figure 15e and plugging in a threshold value for x (in kt). Setting x equal to the threshold values of 35, 50, and 60 kt, yields the probability values shown in Figure 15e.
Figure 15e. Distribution of maximum convective peak wind observations by 5-knot increments, with a Gumbel curve fit to the observed data for the 168 convective periods for the September months in the 18-year (1995-2012) study.