 |
Unlike stronger wind categories, peak convective wind observations that were < 20 kt had a more uniform distribution with height. | |
| Figure 20a. Normalized distribution of maximum peak winds < 20 kt versus tower elevation for the 97 convective periods over the 1995-2012 warm seasons. |
 |
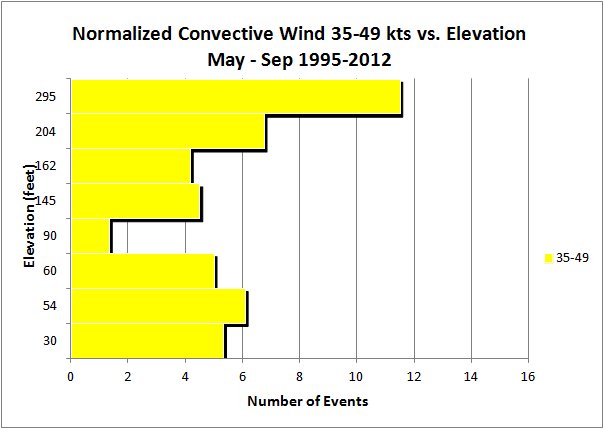
This range also reflects similar characteristics to the ≥ 20 kt distribution with height, but has a better defined and slightly lower turbulent mixed layer. | |
| Figure 20c. Normalized distribution of maximum peak winds 35-49 kt versus tower elevation for the 358 convective periods over the 1995-2012 warm seasons. |