 |
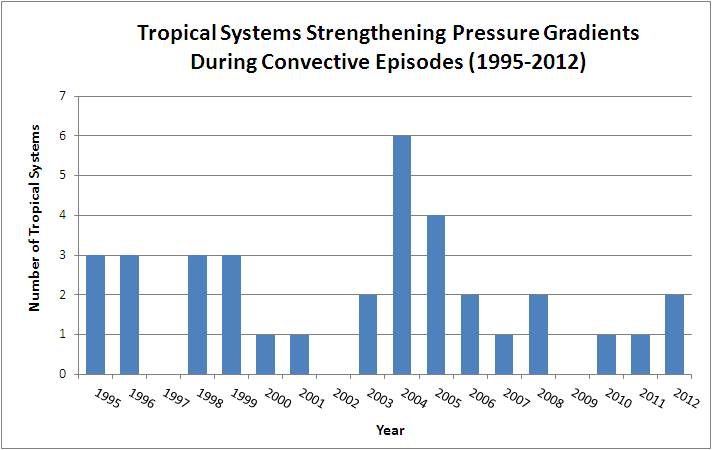
The year that had the most number of tropical systems that affected the Cape Canaveral area was 2004 (6) and the years, 1997, 2002 and 2009, did not have any tropical systems that impacted the area during the warm season. The years, 2009, 2002 and 1997, were also the years that had the greatest number of convective periods. | |
| Distribution of 36 tropical systems from the warm-season months (May-September) during the 18-year (1995-2012) study that caused a strong pressure gradient with convection over the Cape Canaveral Air Force Station/Kennedy Space Center area for whcih convective periods were eliminated. |
 |
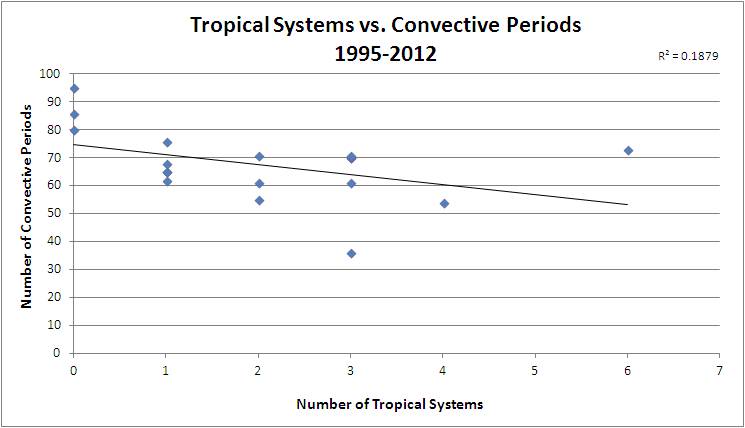
The graph shows the number of convective periods and the number of tropical systems that affected the Cape Canaveral area for each year of the study. The trend is slightly negative, with years that have more tropical systems having less convective periods, which is likely a result of our methodology, which eliminated convection due to strong pressure gradients. This relationship had a very weak correlation of R2 = .1879. | ||
| Scatter plot of the number of convective periods and the number of tropical systems that affected the Cape Canaveral area, where each point represents one of the 17-years (1995-2012) in the study. |