Meteogram Information
Meteograms provide a graphical time summary of past surface observations. The charts used at Plymouth State
generally cover 24-hour periods. The current meteogram for Concord, NH is presented below:

A brief description of the content of these kind of charts follows:
- The green lines on the top graph of the 24hr station charts depict temperatures and dewpoints
(if reported).
- The T(F) line indicates a maximum or minimum temperature (if reported).
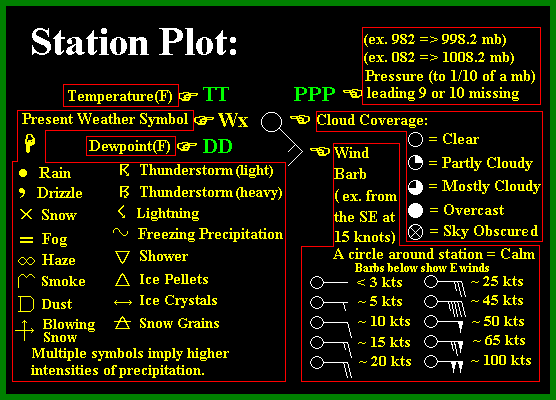
- The WX line indicates the present weather symbol (if reported). For an
explanation of these and other symbols used on this chart, see the following
chart:

- The SNOW line indicates snow (in inches) on the ground (if reported).
- The PREC line indicates rainfall or liquid equivalent of snow and ice in
inches (if reported).
- The VIS line indicates the prevailing visibility in miles (if reported).
- The GUSTS line indicates wind gusts in knots at the time of the
observation (if reported).
- The WINDS line indicates the cloud cover symbol and wind barb (if reported). See chart above.
- The next chart indicates the bases of cloud decks at various altitudes
(if reported). A solid line is overcast, a "--" line means mostly
cloudy, a "-" means scattered deck.
- The Cld(ft) indicates the height of the cloud ceiling in hundreds of
feet (if reported). A ceiling means the lowest cloud deck or summation
of decks covering more than one-half of the sky.
- The line on the bottom graph indicates pressure in millibars (if reported).
- The white numbers at the bottom represent the time of the observation in
Universal Time Coordinates of "Z" time. Eastern Standard Time (EST) lags
these Z-times by 5 hours, whereas Eastern Daylight Time (EDT) lags by 4
hours. Hence, 1200Z time equates to 0700 EST and 2300Z would be 1900 EDT
(i.e. 7:00 P.M.).


